Map tritium production and neutron spectra in a concentric-spheres model.
Map tritium production and neutron spectra in breeder
├── 0. Cross sections
├── 1. Materials
├── 2. Geometry
├── 3. Mean free paths
├── 4. Settings (with source)
├── 5. Tallies
├── 6. Ready and plot
├── 7. Run
└── 8. Output
    ├── Li7_(n,Xt)_convergence
    ├── (n,Xt)
    ├── Neutron fluence
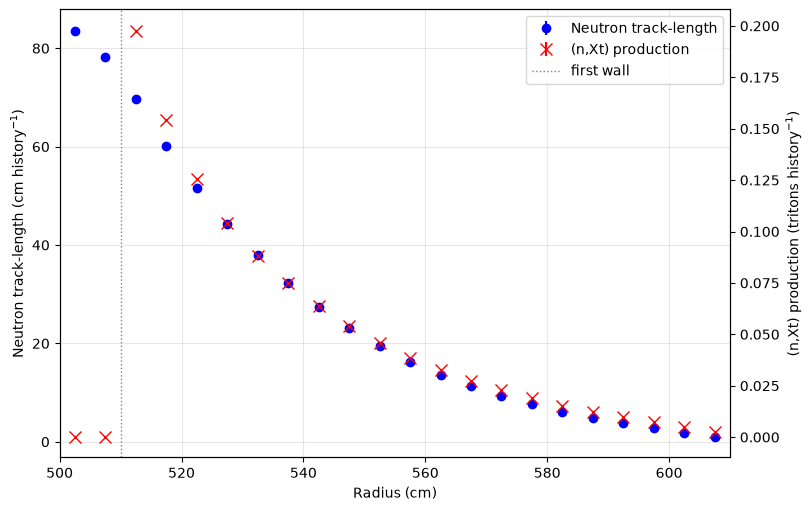
    ├── Energy-integrated radial contributions per spherical shell
    └── Neutron energy spectrum
        ├── First wall (EUROFER)
        └── Breeder (PbLi)
Based on a simple, three-cell concentric-spheres model of a breeder blanket, this notebook follows a think-aloud process of building an initial OpenMC simulation. Cross sections and mean free paths are considered alongside the usual workflow of defining materials, geometry, settings, and tallies.
The simulation tallies neutron fluence as a function of radius and energy, and tritium production in radial shells. Radial bins are arranged so that each lies within a homogeneous material.
The simulation also demonstrates the use of an OpenMC tally trigger to terminate a run once a specified uncertainty criterion is met, somewhat analogous to early stopping in machine learning.
The radii R_VESSEL, FW_THICK, and BB_THICK are adopted from the
Fusion Energy Neutronics Workshop.
import re
from pathlib import Path

import openmc
import numpy as np
import pandas as pd
import matplotlib.pyplot as plt
from matplotlib.colors import LogNorm

from openmc_workbench_config import DATA_ROOT

xs_xml = DATA_ROOT / 'endf-b8.1' / 'cross_sections.xml'
openmc.config['cross_sections'] = xs_xml

SOURCE_eV = 14e6

R_VESSEL = 500.
FW_THICK = 10.
BB_THICK = 100.

output_dir = Path('output_0')
output_dir.mkdir(exist_ok=True)
0. Cross sections
fig = openmc.plotter.plot_xs(
    reactions = {
        'Li6': ['(n,Xt)'],
        'Li7': ['(n,Xt)'],
        'Li': ['(n,Xt)'],
    }
)
ax = fig.axes[0]
ax.axvline(SOURCE_eV, label='source energy',  ls=':', color='k')
ax.set_xlim(right=1e8)
ax.legend()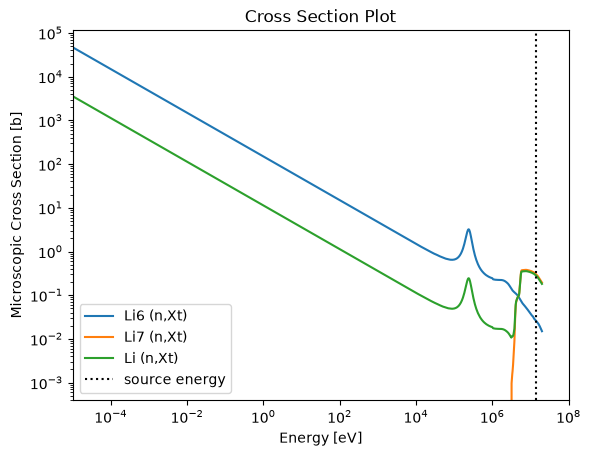
1. Materials
The first wall is represented by a reduced-activation
ferritic/martensitic steel, EUROFER97
(EUROFER97 composition, EUROFER97 density).
# https://docs.openmc.org/en/stable/pythonapi/generated/openmc.Material.html
mats_df = pd.DataFrame(columns=[
    'name', 'element', 'percent', 'percent_type',
    'enrichment', 'enrichment_target', 'enrichment_type',
])

breeder_at = {
    'Pb': 84.2,
    'Li': 15.8,
}

eurofer_wt = {
    'Cr': 8.93,
    'W': 1.07,
    'Mn': 0.47,
    'V': 0.20,
    'Ta': 0.14,
    'C': 0.12,
    'Ti': 0.009,
    'N': 0.018,
}
eurofer_wt['Fe'] = 100 - sum(eurofer_wt.values())

for name, composition, percent_type in [
    ('breeder', breeder_at, 'ao'),
    ('eurofer97', eurofer_wt, 'wo'),
]:
    for element, percent in composition.items():
        enrichment = 50 if name == 'breeder' and element == 'Li' else None
        mats_df.loc[len(mats_df)] = [
            name, element, percent, percent_type,
            enrichment,
            'Li6' if enrichment is not None else None,
            'ao' if enrichment is not None else None,
        ]

mats_dfmats_dic = {}
for name, dat in mats_df.groupby('name'):
mats_dic[name] = openmc.Material(name=name)
for _, row in dat.drop(columns='name').iterrows():
mats_dic[name].add_element(**row.dropna().to_dict())
mats_dic['breeder'].set_density('atom/b-cm', 3.2720171e-2)
mats_dic['eurofer97'].set_density('g/cm3', 7.78)
mats_dic{'breeder': Material
ID = 1
Name = breeder
Temperature = None
Density = 0.032720171 [atom/b-cm]
Volume = None [cm^3]
Depletable = False
S(a,b) Tables
Nuclides
Pb204 = 1.1788 [ao]
Pb206 = 20.2922 [ao]
Pb207 = 18.6082 [ao]
Pb208 = 44.1208 [ao]
Li6 = 7.9 [ao]
Li7 = 7.9 [ao],
'eurofer97': Material
ID = 2
Name = eurofer97
Temperature = None
Density = 7.78 [g/cm3]
Volume = None [cm^3]
Depletable = False
S(a,b) Tables
Nuclides
Cr50 = 0.3727102154087453 [wo]
Cr52 = 7.474353057975188 [wo]
Cr53 = 0.8638513029076939 [wo]
Cr54 = 0.21908542370837283 [wo]
W180 = 0.001256795818590312 [wo]
W182 = 0.2806294293962744 [wo]
W183 = 0.15237444705438208 [wo]
W184 = 0.3280426553349992 [wo]
W186 = 0.30769667239575416 [wo]
Mn55 = 0.47 [wo]
V50 = 0.0004902406716450924 [wo]
V51 = 0.1995097593283549 [wo]
Ta180_m1 = 1.6721040044200308e-05 [wo]
Ta181 = 0.13998327895995583 [wo]
C12 = 0.11856082141028239 [wo]
C13 = 0.001439178589717617 [wo]
Ti46 = 0.0007128085694198449 [wo]
Ti47 = 0.0006568004090875696 [wo]
Ti48 = 0.006646054703024111 [wo]
Ti49 = 0.0004978971484352276 [wo]
Ti50 = 0.00048643917003324564 [wo]
N14 = 0.01792938983956732 [wo]
N15 = 7.061016043267816e-05 [wo]
Fe54 = 5.0269744082448655 [wo]
Fe56 = 81.8318782711858 [wo]
Fe57 = 1.9236570246743068 [wo]
Fe58 = 0.26049029589503647 [wo]}model = {}
model['materials'] = openmc.Materials(mats_dic.values())2. Geometry
geom_df = pd.DataFrame(
    columns=['radius_cm', 'boundary_type', 'region', 'mats']
)
geom_df.loc['vessel_inner'] = [R_VESSEL, None, '-vessel_inner', None]
geom_df.loc['first_wall'] = [
    R_VESSEL + FW_THICK, None, '-first_wall & +vessel_inner', 'eurofer97'
]
geom_df.loc['breeder_blanket'] = [
    R_VESSEL + FW_THICK + BB_THICK,
    'vacuum', '+first_wall & -breeder_blanket', 'breeder',
]
geom_df# Ensure that all surfaces referenced in region expressions are
# defined in geom_df.index.
assert all(
name in geom_df.index
for region in geom_df['region']
for name in re.findall(r'\b\w+\b', region)
)sphere = {}
for name, dat in geom_df.iterrows():
sphere[name] = openmc.Sphere(
r=dat['radius_cm'],
**dat[['boundary_type']].dropna().to_dict()
)# Convert named surface expressions into OpenMC regions.
# https://docs.openmc.org/en/stable/pythonapi/generated/openmc.Region.html
surfaces = {s.id: s for s in sphere.values()}
def str2region(string):
for name, surface in sphere.items():
string = string.replace(name, str(surface.id))
string = string.replace('&', ' ')
return openmc.Region.from_expression(string, surfaces)
geom = {}
for name, dat in geom_df.iterrows():
geom[name] = openmc.Cell(
name=name,
region=str2region(dat['region']),
fill=mats_dic.get(dat['mats'])
)
model['geometry'] = openmc.Geometry(geom.values())3. Mean free paths
for name, mat in mats_dic.items():
    geom_df.loc[geom_df['mats'] == name, 'mfp@14MeV_cm'] = (
        mat.mean_free_path(SOURCE_eV)
    )

geom_df4. Settings (with source)
model['settings'] = openmc.Settings()
model['settings'].seed = 77
model['settings'].batches = 5
model['settings'].particles = 10000
model['settings'].run_mode = 'fixed source'

model['settings'].trigger_active = True
model['settings'].trigger_max_batches = 100
model['settings'].trigger_batch_interval = 5

model['settings'].source = openmc.IndependentSource(
    space=openmc.stats.Point((0, 0, 0)),
    angle=openmc.stats.Isotropic(),
    energy=openmc.stats.Discrete([SOURCE_eV], [1])
)
5. Tallies
For this simulation, the TBR is the number of tritium nuclei produced per source neutron.
cell_filter = openmc.CellFilter(geom['breeder_blanket'])

tic = R_VESSEL
toc = R_VESSEL + FW_THICK + BB_THICK
num = int(1 + (toc - tic) // 5)
r_edges = np.linspace(tic, toc, num)

# Logarithmic energy bins (eV), extending beyond the 14-MeV source.
E_edges = np.logspace(-3, np.log10(20e6), 101)

mesh_filter = openmc.MeshFilter(openmc.SphericalMesh(r_grid=r_edges))
energy_filter = openmc.EnergyFilter(E_edges)

model['tallies'] = openmc.Tallies([
    openmc.Tally(
        name='(n,Xt)',
        # Exclude vessel_inner and first_wall.
        filters=[cell_filter],
        scores=['(n,Xt)'],
        nuclides=mats_dic['breeder'].get_nuclides() + ['total'],
    ),
    openmc.Tally(
        name='Li7_(n,Xt)_convergence',
        filters=[cell_filter],
        scores=['(n,Xt)'],
        nuclides=['Li7'],
        triggers=[openmc.Trigger('rel_err', 0.01)],
    ),
    # OpenMC calls its track-length score 'flux' (particle-cm per source
    # particle). After division by volume, the result is neutron fluence
    # per history, not fluence rate; the latter also needs a source rate.
    # https://docs.openmc.org/en/stable/usersguide/tallies.html

    # Resolve neutron fluence by radius and incident energy.
    openmc.Tally(
        name='fluence_r_E',
        filters=[mesh_filter, energy_filter],
        scores=['flux'],
    ),
    # Radial bins: integrate neutron track-length and (n,Xt) production.
    openmc.Tally(
        name='fluence_n_Xt_r',
        filters=[mesh_filter],
        scores=['flux', '(n,Xt)'],
    ),
])
6. Ready and plot
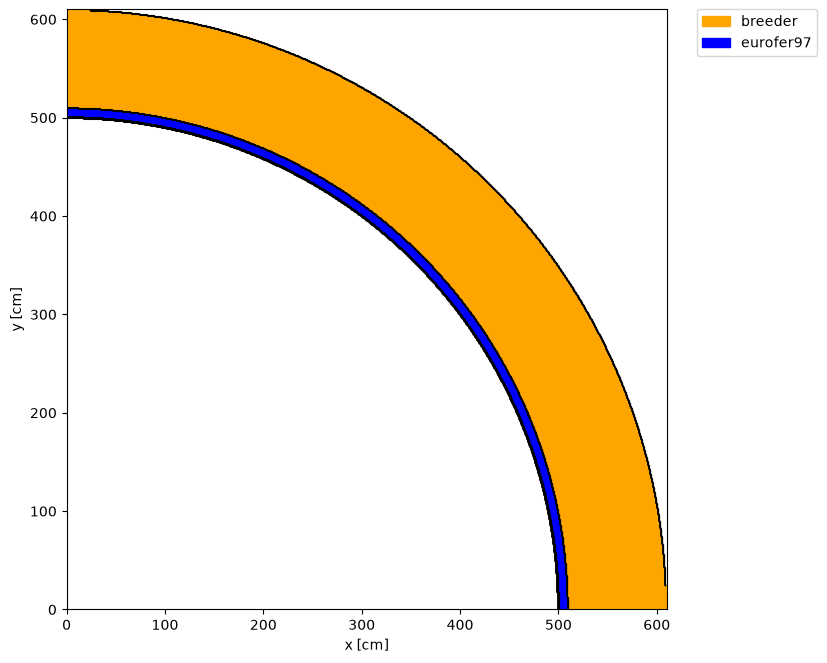
Due to the spherical symmetry of the geometry, plotting just one quadrant is good.
openmc_model = openmc.Model(**model)
colors = {
    mats_dic['breeder']: 'orange',
    mats_dic['eurofer97']: 'blue',
}

R = 610

ax = openmc_model.plot(
    basis='xy',
    origin=(R/2, R/2, 0),
    width=(R, R),
    color_by='material',
    colors=colors,
    outline=True,
    legend=True,
    pixels=(600, 600),
)
7. Run
sp_filename = openmc_model.run(cwd=output_dir) %%%%%%%%%%%%%%%
%%%%%%%%%%%%%%%%%%%%%%%%
%%%%%%%%%%%%%%%%%%%%%%%%%%%%%%
%%%%%%%%%%%%%%%%%%%%%%%%%%%%%%%%%%
%%%%%%%%%%%%%%%%%%%%%%%%%%%%%%%%%%%%%%
%%%%%%%%%%%%%%%%%%%%%%%%%%%%%%%%%%%%%%%%
%%%%%%%%%%%%%%%%%%%%%%%%
%%%%%%%%%%%%%%%%%%%%%%%%
############### %%%%%%%%%%%%%%%%%%%%%%%%
################## %%%%%%%%%%%%%%%%%%%%%%%
################### %%%%%%%%%%%%%%%%%%%%%%%
#################### %%%%%%%%%%%%%%%%%%%%%%
##################### %%%%%%%%%%%%%%%%%%%%%
###################### %%%%%%%%%%%%%%%%%%%%
####################### %%%%%%%%%%%%%%%%%%
####################### %%%%%%%%%%%%%%%%%
###################### %%%%%%%%%%%%%%%%%
#################### %%%%%%%%%%%%%%%%%
################# %%%%%%%%%%%%%%%%%
############### %%%%%%%%%%%%%%%%
############ %%%%%%%%%%%%%%%
######## %%%%%%%%%%%%%%
%%%%%%%%%%%
| The OpenMC Monte Carlo Code
Copyright | 2011-2026 MIT, UChicago Argonne LLC, and contributors
License | https://docs.openmc.org/en/latest/license.html
Version | 0.16.0
Commit Hash | 617d35a5063c57796b43428bc401e627d2011046
Date/Time | 2026-11-06 19:37:15
OpenMP Threads | 16
Reading model XML file 'model.xml' ...
Reading cross sections XML file...
Reading Pb204 from
/Users/marychin/gitlabcode/power/data/endf-b8.1/neutron/Pb204.h5
Reading Pb206 from
/Users/marychin/gitlabcode/power/data/endf-b8.1/neutron/Pb206.h5
Reading Pb207 from
/Users/marychin/gitlabcode/power/data/endf-b8.1/neutron/Pb207.h5
Reading Pb208 from
/Users/marychin/gitlabcode/power/data/endf-b8.1/neutron/Pb208.h5
Reading Li6 from /Users/marychin/gitlabcode/power/data/endf-b8.1/neutron/Li6.h5
Reading Li7 from /Users/marychin/gitlabcode/power/data/endf-b8.1/neutron/Li7.h5
Reading Cr50 from
/Users/marychin/gitlabcode/power/data/endf-b8.1/neutron/Cr50.h5
Reading Cr52 from
/Users/marychin/gitlabcode/power/data/endf-b8.1/neutron/Cr52.h5
Reading Cr53 from
/Users/marychin/gitlabcode/power/data/endf-b8.1/neutron/Cr53.h5
Reading Cr54 from
/Users/marychin/gitlabcode/power/data/endf-b8.1/neutron/Cr54.h5
Reading W180 from
/Users/marychin/gitlabcode/power/data/endf-b8.1/neutron/W180.h5
Reading W182 from
/Users/marychin/gitlabcode/power/data/endf-b8.1/neutron/W182.h5
Reading W183 from
/Users/marychin/gitlabcode/power/data/endf-b8.1/neutron/W183.h5
Reading W184 from
/Users/marychin/gitlabcode/power/data/endf-b8.1/neutron/W184.h5
Reading W186 from
/Users/marychin/gitlabcode/power/data/endf-b8.1/neutron/W186.h5
Reading Mn55 from
/Users/marychin/gitlabcode/power/data/endf-b8.1/neutron/Mn55.h5
Reading V50 from /Users/marychin/gitlabcode/power/data/endf-b8.1/neutron/V50.h5
Reading V51 from /Users/marychin/gitlabcode/power/data/endf-b8.1/neutron/V51.h5
Reading Ta180_m1 from
/Users/marychin/gitlabcode/power/data/endf-b8.1/neutron/Ta180_m1.h5
Reading Ta181 from
/Users/marychin/gitlabcode/power/data/endf-b8.1/neutron/Ta181.h5
Reading C12 from /Users/marychin/gitlabcode/power/data/endf-b8.1/neutron/C12.h5
Reading C13 from /Users/marychin/gitlabcode/power/data/endf-b8.1/neutron/C13.h5
Reading Ti46 from
/Users/marychin/gitlabcode/power/data/endf-b8.1/neutron/Ti46.h5
Reading Ti47 from
/Users/marychin/gitlabcode/power/data/endf-b8.1/neutron/Ti47.h5
Reading Ti48 from
/Users/marychin/gitlabcode/power/data/endf-b8.1/neutron/Ti48.h5
Reading Ti49 from
/Users/marychin/gitlabcode/power/data/endf-b8.1/neutron/Ti49.h5
Reading Ti50 from
/Users/marychin/gitlabcode/power/data/endf-b8.1/neutron/Ti50.h5
Reading N14 from /Users/marychin/gitlabcode/power/data/endf-b8.1/neutron/N14.h5
Reading N15 from /Users/marychin/gitlabcode/power/data/endf-b8.1/neutron/N15.h5
Reading Fe54 from
/Users/marychin/gitlabcode/power/data/endf-b8.1/neutron/Fe54.h5
Reading Fe56 from
/Users/marychin/gitlabcode/power/data/endf-b8.1/neutron/Fe56.h5
Reading Fe57 from
/Users/marychin/gitlabcode/power/data/endf-b8.1/neutron/Fe57.h5
Reading Fe58 from
/Users/marychin/gitlabcode/power/data/endf-b8.1/neutron/Fe58.h5
Minimum neutron data temperature: 294 K
Maximum neutron data temperature: 294 K
Preparing distributed cell instances...
Writing summary.h5 file...
Maximum neutron transport energy: 20000000 eV for Pb207
===============> FIXED SOURCE TRANSPORT SIMULATION <===============
Simulating batch 1
Simulating batch 2
Simulating batch 3
Simulating batch 4
Simulating batch 5
Triggers unsatisfied, max unc./thresh. is 1.038061458706702 for (n,Xt) in tally
2
Creating state point statepoint.005.h5...
Simulating batch 6
Simulating batch 7
Simulating batch 8
Simulating batch 9
Simulating batch 10
Triggers satisfied for batch 10
Creating state point statepoint.010.h5...
=======================> TIMING STATISTICS <=======================
Total time for initialization = 1.7712e+00 seconds
Reading cross sections = 1.7664e+00 seconds
Total time in simulation = 4.1148e+00 seconds
Time in transport only = 4.1090e+00 seconds
Time in active batches = 4.1148e+00 seconds
Time accumulating tallies = 1.9024e-03 seconds
Time writing statepoints = 3.7251e-03 seconds
Total time for finalization = 1.3361e-03 seconds
Total time elapsed = 5.8902e+00 seconds
Calculation Rate (active) = 24302.7 particles/second
============================> RESULTS <============================
Leakage Fraction = 0.05328 +/- 0.00072
8. Output
# Collect every tally in the statepoint, indexed by its name.
with openmc.StatePoint(sp_filename) as sp:
    tallies = {t.name: t for t in sp.tallies.values()}
    completed_batches = sp.current_batch

list(tallies)
['(n,Xt)', 'Li7_(n,Xt)_convergence', 'fluence_r_E', 'fluence_n_Xt_r']Li7_(n,Xt)_convergence
rel_err = tallies['Li7_(n,Xt)_convergence'].get_values(
    value='rel_err'
).item()

# The trigger definition belongs to the model, not the statepoint.
trigger_tally = next(
    t for t in openmc_model.tallies
    if t.name == 'Li7_(n,Xt)_convergence'
)
trigger_value = trigger_tally.triggers[0].threshold

rel_err, trigger_value
(0.009367305299817096, 0.01)if rel_err > trigger_value:
assert (
completed_batches >= openmc_model.settings.trigger_max_batches
)(n,Xt)
tallies['(n,Xt)']Tally
ID = 1
Name = (n,Xt)
Filters = CellFilter
Nuclides = Pb204 Pb206 Pb207 Pb208 Li6 Li7 total
Scores = ['(n,Xt)']
Estimator = tracklength
Multiply dens. = Truedf_n_Xt = tallies['(n,Xt)'].get_pandas_dataframe()
df_n_Xt['rel_err'] = df_n_Xt['std. dev.'] / df_n_Xt['mean'].abs()
df_n_Xt.sort_values('mean', ascending=False)Neutron fluence
The fluence map is normalized by spherical-shell volume and lethargy-bin width. The second map shows relative statistical error; bins with zero fluence are blank.
# Extract neutron fluence from the radius–energy tally.
fluence_tally = tallies['fluence_r_E']
mesh = fluence_tally.find_filter(openmc.MeshFilter).mesh
energy_filter = fluence_tally.find_filter(openmc.EnergyFilter)

fluence = fluence_tally.get_reshaped_data(value='mean').squeeze()
fluence_std = fluence_tally.get_reshaped_data(value='std_dev').squeeze()

volumes = mesh.volumes[:, 0, 0]
du = np.log(E_edges[1:] / E_edges[:-1])
fluence_per_lethargy = fluence / volumes[:, None] / du[None, :]

# Relative error is undefined where the mean is zero.
fluence_rel_err = np.full_like(fluence, np.nan)
np.divide(
    fluence_std, np.abs(fluence), out=fluence_rel_err,
    where=fluence != 0,
)

# Plot the fluence and its relative statistical error.
values_plot = np.ma.masked_less_equal(fluence_per_lethargy.T, 0)
err_plot = np.ma.masked_invalid(100 * fluence_rel_err.T)

fig, axes = plt.subplots(
    1, 2, figsize=(14, 5), sharex=True, sharey=True,
    layout='constrained',
)

pcm_value = axes[0].pcolormesh(
    mesh.r_grid, energy_filter.values, values_plot,
    cmap='hot_r', norm=LogNorm(), shading='auto',
)
pcm_err = axes[1].pcolormesh(
    mesh.r_grid, energy_filter.values, err_plot,
    cmap='hot_r', vmin=0, vmax=100, shading='auto',
)

for ax in axes:
    ax.set(yscale='log', xlabel='Radius (cm)')
    for r in geom_df['radius_cm']:
        ax.axvline(r, color='gray', ls=':', lw=1)

axes[0].set(title='Neutron fluence', ylabel='Incident neutron energy (eV)')
axes[1].set_title('Relative statistical error: Neutron fluence')

fig.colorbar(
    pcm_value, ax=axes[0],
    label=r'Neutron fluence ($d\Phi/d\ln E$, cm$^{-2}$ history$^{-1}$)',
)
fig.colorbar(
    pcm_err, ax=axes[1], label='Relative error (%)', extend='max',
)
plt.show()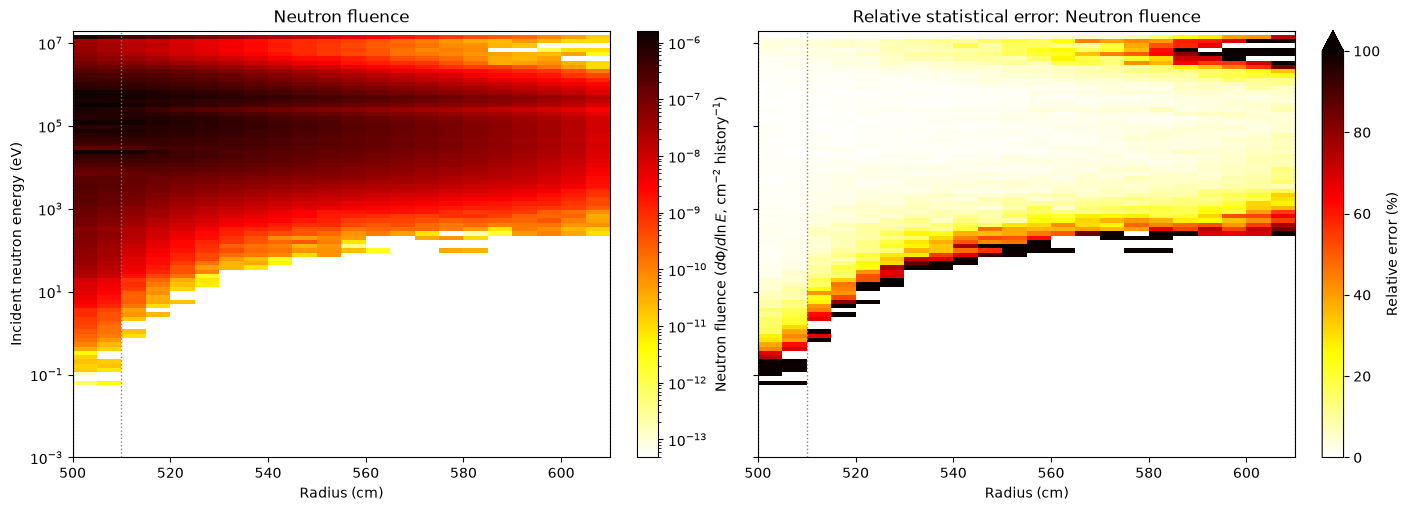
Energy-integrated radial contributions per spherical shell
The two profiles show neutron track-length and (n,Xt) production
integrated over each spherical shell, without dividing by shell volume.
The (n,Xt) score estimates tritium nuclei produced per source neutron;
it is not transported triton fluence.
radial_tally = tallies['fluence_n_Xt_r']
mesh_r = radial_tally.find_filter(openmc.MeshFilter).mesh
fluence_r_tally = radial_tally.get_slice(scores=['flux'])
assert '(n,Xt)' in radial_tally.scores, radial_tally.scores
n_Xt_r_tally = radial_tally.get_slice(scores=['(n,Xt)'])

# Each score is integrated over each spherical shell and over energy.
# Do not divide by shell volume.
fluence_r = fluence_r_tally.get_reshaped_data(value='mean').squeeze()
fluence_r_std = fluence_r_tally.get_reshaped_data(value='std_dev').squeeze()
n_Xt_r = n_Xt_r_tally.get_reshaped_data(value='mean').squeeze()
n_Xt_r_std = n_Xt_r_tally.get_reshaped_data(value='std_dev').squeeze()

r_mid = (mesh_r.r_grid[:-1] + mesh_r.r_grid[1:]) / 2

fig, ax_fluence = plt.subplots(figsize=(8, 5), layout='constrained')
ax_n_Xt = ax_fluence.twinx()

fluence_profile = ax_fluence.errorbar(
    r_mid, fluence_r, yerr=fluence_r_std,
    fmt='o', ls='none',
    color='blue', ecolor='blue',
    label='Neutron track-length',
)
n_Xt_profile = ax_n_Xt.errorbar(
    r_mid, n_Xt_r, yerr=n_Xt_r_std,
    fmt='x', ls='none', ms=8,
    color='red', ecolor='red',
    label='(n,Xt) production',
)

r = geom_df.loc['first_wall', 'radius_cm']
first_wall = ax_fluence.axvline(
    r, color='gray', ls=':', lw=1, label='first wall'
)

ax_fluence.set(
    xlabel='Radius (cm)',
    ylabel='Neutron track-length (cm history$^{-1}$)',
    xlim=(mesh_r.r_grid[0], mesh_r.r_grid[-1]),
)
ax_n_Xt.set_ylabel('(n,Xt) production (tritons history$^{-1}$)')

ax_fluence.grid(alpha=0.3)
ax_fluence.legend(
    [fluence_profile, n_Xt_profile, first_wall],
    [
        fluence_profile.get_label(),
        n_Xt_profile.get_label(),
        first_wall.get_label(),
    ],
)
Neutron energy spectrum
First wall (EUROFER)
def plot_neutron_spectrum(r_bin, xs_E, xs, xs_label, xs_unit):
    """Plot a shell's neutron spectrum, uncertainty, and cross section."""
    spectrum = fluence_per_lethargy[r_bin, :]
    error_percent = 100 * fluence_rel_err[r_bin, :]

    fig, ax = plt.subplots(figsize=(10, 5.5))
    fig.subplots_adjust(left=0.13, right=0.73, bottom=0.23, top=0.97)
    ax_err = ax.twinx()
    ax_xs = ax.twinx()
    ax_xs.spines['right'].set_position(('outward', 65))

    fluence_curve = ax.stairs(
        np.where(spectrum > 0, spectrum, np.nan),
        E_edges, label='Neutron fluence', color='tab:blue',
    )
    error_curve = ax_err.stairs(
        error_percent, E_edges,
        label='Relative error', color='tab:red',
    )
    xs_curve, = ax_xs.plot(
        xs_E, np.where(xs > 0, xs, np.nan),
        label=xs_label, color='tab:green', lw=0.8, alpha=0.8,
    )

    ax.set(
        xscale='log', yscale='log',
        xlim=(E_edges[0], E_edges[-1]),
        xlabel='Neutron energy (eV)',
        ylabel=(
            r'Neutron fluence per unit lethargy '
            r'(cm$^{-2}$ history$^{-1}$)'
        ),
    )
    ax_err.set_ylabel('Relative statistical error (%)', color='tab:red')
    ax_err.tick_params(axis='y', colors='tab:red')
    ax_err.set_ylim(bottom=0)
    ax_xs.set_yscale('log')
    ax_xs.set_ylabel(f'{xs_label} ({xs_unit})', color='tab:green')
    ax_xs.tick_params(axis='y', colors='tab:green')
    ax.grid(which='both', alpha=0.3)

    curves = [fluence_curve, error_curve, xs_curve]
    fig.legend(
        handles=curves, labels=[c.get_label() for c in curves],
        loc='lower center', bbox_to_anchor=(0.5, 0.02),
        ncol=3, frameon=False,
    )
    plt.show()

xs_E, xs_data = openmc.plotter.calculate_cexs(
    'Fe56', ['total'], cross_sections=str(xs_xml),
)
plot_neutron_spectrum(
    0, xs_E, xs_data[0], 'Fe-56 total cross section', 'b',
)
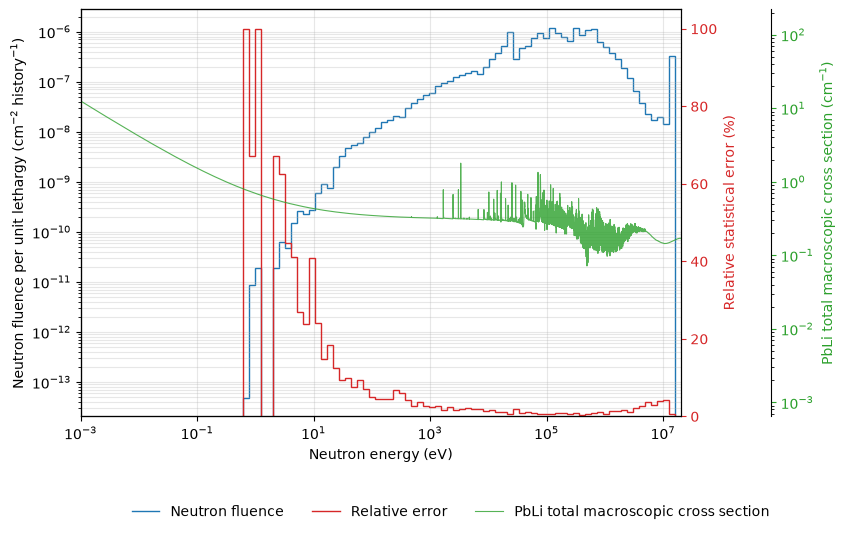
# The jagged features in the high-energy fluence spectrum are consistent
# with resonance structure in the neutron cross sections. The relative
# statistical errors are small compared with the spectral variations.
# Note that Fe-56 is only one constituent of EUROFER97, and its
# microscopic cross section is not the total macroscopic cross section
# of the steel.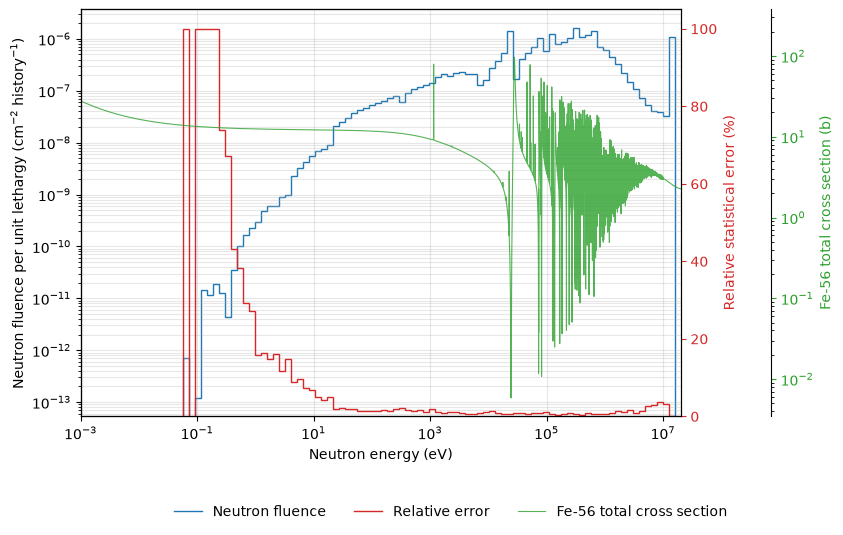
Breeder (PbLi)
breeder_bin = 2
assert np.isclose(
    mesh.r_grid[breeder_bin],
    R_VESSEL + FW_THICK,
)

xs_E, xs_data = openmc.plotter.calculate_cexs(
    mats_dic['breeder'], ['total'], cross_sections=str(xs_xml),
)
plot_neutron_spectrum(
    breeder_bin, xs_E, xs_data[0],
    'PbLi total macroscopic cross section', r'cm$^{-1}$',
)